Visualizing Typed Functions

I'm not sure what the policy is on posting with graphical attachments, but I'll give this a tentative try. In case this does not come through with images, I've also posted this on my blog at http://blog.inquirylabs.com/2009/05/07/visualizing-typed-functions/ ===== As I've worked in Haskell over the past several months, I've noticed that my mind has kind of implicitly modeled functional programming as a visual/mechanical representation of concepts. I'd like to make the ideas more explicit, however, so I'm writing this post and cooking up some graphics. I wonder if others have similar "internal representations" of functions, and if perhaps others might suggest improvements over my model. The basic idea is that a function is a semi-circle with inputs on one side (left) and the output at the right. Colors represent types. Here is a function that takes one input and produces one output (of the same type): Haskell would type this as "a -> a". Next, we have a function that takes one type and returns a different type... e.g. a hashing function might take a string and return an integer: (Please ignore the vertical stripe, it's an artifact of my poor Inkscape skills). We can also create functions with more than one input, of course, so here is a binary function. It might be the '+' operator, or some other binary operator, e.g. "a -> a -> a": Haskell and many other languages also have the concept of higher-order functions, i.e. functions that take functions as inputs. Here is a binary function that takes a binary function as input, along with another input, to produce an output of the same type: I imagine polymorphic types as "banded colors" so that the bands contain another type (color). Lists are polymorphic types. Here is what the "head" function might look like ("head" returns the first element in a list): Finally, here is a composite of all of the above visualizations. The "map" function in Haskell is a function that takes a function and a list, and applies that function to each element in the list, returning a new list with the "mapped" elements: The type signature for the "map" function is "(a -> b) -> [a] -> [b]". I wonder what a Monad would look like... With these functions visualized, one could make a kind of "drag and drop" interface for Haskell programming, although that isn't really my intention. I admit this is a little convoluted even for the purpose of visualization, but at least it's a starting place. Does anyone know of another system or better representation?

Do you have code to generate these images from type signatures? If so I'd *love* to see it. On Thu, May 7, 2009 at 5:01 PM, Duane Johnson <duane.johnson@gmail.com>wrote:
I'm not sure what the policy is on posting with graphical attachments, but I'll give this a tentative try. In case this does not come through with images, I've also posted this on my blog at
http://blog.inquirylabs.com/2009/05/07/visualizing-typed-functions/
=====
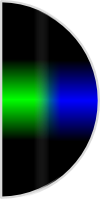
As I've worked in Haskell over the past several months, I've noticed that my mind has kind of implicitly modeled functional programming as a visual/mechanical representation of concepts. I'd like to make the ideas more explicit, however, so I'm writing this post and cooking up some graphics. I wonder if others have similar "internal representations" of functions, and if perhaps others might suggest improvements over my model. The basic idea is that a function is a semi-circle with inputs on one side (left) and the output at the right. Colors represent types. Here is a function that takes one input and produces one output (of the same type):
Haskell would type this as "a -> a". Next, we have a function that takes one type and returns a different type... e.g. a hashing function might take a string and return an integer:
(Please ignore the vertical stripe, it's an artifact of my poor Inkscape skills). We can also create functions with more than one input, of course, so here is a binary function. It might be the '+' operator, or some other binary operator, e.g. "a -> a -> a":
Haskell and many other languages also have the concept of higher-order functions, i.e. functions that take functions as inputs. Here is a binary function that takes a binary function as input, along with another input, to produce an output of the same type:
I imagine polymorphic types as "banded colors" so that the bands contain another type (color). Lists are polymorphic types. Here is what the "head" function might look like ("head" returns the first element in a list):
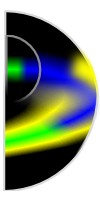
Finally, here is a composite of all of the above visualizations. The "map" function in Haskell is a function that takes a function and a list, and applies that function to each element in the list, returning a new list with the "mapped" elements:
The type signature for the "map" function is "(a -> b) -> [a] -> [b]". I wonder what a Monad would look like...
With these functions visualized, one could make a kind of "drag and drop" interface for Haskell programming, although that isn't really my intention. I admit this is a little convoluted even for the purpose of visualization, but at least it's a starting place. Does anyone know of another system or better representation?
_______________________________________________ Haskell-Cafe mailing list Haskell-Cafe@haskell.org http://www.haskell.org/mailman/listinfo/haskell-cafe
-- /jve
No, this is a first-time draft that I made by hand using Inkscape. If we get to a point where a consistent set of visualizations makes sense, it would be rewarding to turn into code though. -- Duane On May 7, 2009, at 3:06 PM, John Van Enk wrote:
Do you have code to generate these images from type signatures? If so I'd *love* to see it.

Duane Johnson wrote:
With these functions visualized, one could make a kind of "drag and drop" interface for Haskell programming, although that isn't really my intention. I admit this is a little convoluted even for the purpose of visualization, but at least it's a starting place. Does anyone know of another system or better representation?
You must to take a look at this: Tangible Functional Programming http://www.youtube.com/watch?v=faJ8N0giqzw And, a little bit off topic but cool stuff: Vacuum: visualize Haskell data structures live http://www.youtube.com/watch?v=X4-212uMgy8 @ It seems that we are getting pretty close to the point that youtube is getting to be a better reference than a paper, at least for practitioners. A lot of talks are on youtube :)
Thank you, that was very instructive! Tangible Values look very interesting. -- Duane On May 7, 2009, at 3:11 PM, Ahn, Ki Yung wrote:
Duane Johnson wrote:
With these functions visualized, one could make a kind of "drag and drop" interface for Haskell programming, although that isn't really my intention. I admit this is a little convoluted even for the purpose of visualization, but at least it's a starting place. Does anyone know of another system or better representation?
You must to take a look at this:
Tangible Functional Programming http://www.youtube.com/watch?v=faJ8N0giqzw
And, a little bit off topic but cool stuff:
Vacuum: visualize Haskell data structures live http://www.youtube.com/watch?v=X4-212uMgy8
@ It seems that we are getting pretty close to the point that youtube is getting to be a better reference than a paper, at least for practitioners. A lot of talks are on youtube :)
_______________________________________________ Haskell-Cafe mailing list Haskell-Cafe@haskell.org http://www.haskell.org/mailman/listinfo/haskell-cafe

With these functions visualized, one could make a kind of "drag and drop" interface for Haskell programming, although that isn't really my intention. I admit this is a little convoluted even for the purpose of visualization, but at least it's a starting place. Does anyone know of another system or better representation?
Sure, google for visual programming languages - some examples: - there was a "Visual Haskell", before the Visual Studio plugin http://ptolemy.eecs.berkeley.edu/~johnr/papers/ - dissect a mockingbird http://users.bigpond.net.au/d.keenan/Lambda/ - vpl bibliography http://web.engr.oregonstate.edu/~burnett/vpl.html
@ It seems that we are getting pretty close to the point that youtube is getting to be a better reference than a paper, at least for practitioners. A lot of talks are on youtube :)
You could always post a screencast of yourself reading a paper!-) Claus

Duane, Your fourth diagram is hard to distinguish from that for a function that takes three inputs and returns one. And what would be the diagram for a function that maps one binary function to another? I spend a bit of my time at work playing with typed visual dataflow type tools. I've never really seen a satisfactory visual scheme for clearly representing higher order functions and I've never managed to come up with one myself. -- Dan On Thu, May 7, 2009 at 2:01 PM, Duane Johnson <duane.johnson@gmail.com> wrote:
I'm not sure what the policy is on posting with graphical attachments, but I'll give this a tentative try. In case this does not come through with images, I've also posted this on my blog at http://blog.inquirylabs.com/2009/05/07/visualizing-typed-functions/

I've never really seen a satisfactory visual scheme for clearly representing higher order functions
I saw a visual scheme for this purpose at FDPE'08. It uses an alternating colouring scheme, representing arguments as holes: a hole in a black thing is white and a hole in a white thing is black. I only found an ACM link: http://portal.acm.org/citation.cfm?id=1411272 Cheers, Sebastian
participants (6)
-
 Ahn, Ki Yung
 -
 Claus Reinke
 -
 Dan Piponi
 -
 Duane Johnson
 -
 John Van Enk
 -
 Sebastian Fischer