Fwd: [Haskell-cafe] Graphical representation of Haskell code

Hi all, Concerning INblobs, it's again online; a fire damaged the cable that links the university to the world!! I don't update the tool for a long time... but I'll take a look on that. Concerning visual functional programming, see this small chapter of my thesis about some of the existing languages. There are more subtleties on the visual side than those expected!! If you also consider debugging tools, take a look on Ghood http://hackage.haskell.org/package/GHood best regards Miguel Vilaça A 2010/03/23, às 05:31, Ronald Guida escreveu:
On Mon, Mar 22, 2010 at 7:02 PM, Dupont Corentin <corentin.dupont@gmail.com> wrote:
Hello, I’m relatively new to Haskell. I’m wondering if it exist a tool to graphically represent Haskell code. ... Let’s try to do it on a simple example, as an exercise: f = Map (+1)
Your graphic for "f = map (+1)" seems much more complex than the corresponding code. I would agree with Ivan Miljenovic:
I'm of the opinion that unless you just use it on small snippets, the generated images will be too large and unwieldy.
The first question I would ask is /why/ would you like to visualize some Haskell code? If you want to see the high-level structure of a complex program, try SourceGraph. (I have never used it though.)
On the other hand, if you are trying to visualize Haskell as part of your efforts to learn the language, then I believe it would be best to draw diagrams by hand, rather than relying on an automated tool. The kinds of things that you'll want to depict are probably going to vary considerably, depending on what you're trying to understand.
Consider a few different implementations of the "map" function:
-- version 1: recursion map1 :: (a -> b) -> [a] -> [b] map1 f [] = [] map1 f (x:xs) = (f x) : map1 f xs
-- version 2: fold map2 :: (a -> b) -> [a] -> [b] map2 f = foldr ((:) . f) []
-- version 3: continuation passing style map3 :: (a -> b) -> [a] -> [b] map3 f xs = map' (\x y -> f x : y) xs where map' k [] = [] map' k (y:ys) = k y (map' k ys)
-- version 4: list comprehension map4 :: (a -> b) -> [a] -> [b] map4 f xs = [f x | x <- xs]
-- version 5: list monad map5 :: (a -> b) -> [a] -> [b] map5 f xs = xs >>= (return . f)
These all do exactly the same thing, but each one uses different techniques. If I'm trying to learn (or teach) Haskell, I would probably need a slightly different visual "language" for each one in order to capture the most relevant concepts in a useful way. How would you visualize them?
@Mihai Maruseac: I think a visual debugger would be a wonderful idea. You may want to consider how a visual debugger would work with each of these versions of map.
:-) You might also consider several versions of factorial :-) http://www.willamette.edu/~fruehr/haskell/evolution.html
-- Ron _______________________________________________ Haskell-Cafe mailing list Haskell-Cafe@haskell.org http://www.haskell.org/mailman/listinfo/haskell-cafe

Hello, Very interresting. Visual Haskell seems to be very close to the thing i imagined. Mihai what do you think? Unfortunatly i cannot find it on the web! There is something for MS Visual Studio but i don't think this is the same... Corentin On Thu, Mar 25, 2010 at 12:07 AM, Miguel Vilaca <jmvilaca@di.uminho.pt>wrote:
Hi all,
Concerning INblobs, it's again online; a fire damaged the cable that links the university to the world!! I don't update the tool for a long time... but I'll take a look on that.
Concerning visual functional programming, see this small chapter of my thesis about some of the existing languages.
There are more subtleties on the visual side than those expected!!
If you also consider debugging tools, take a look on Ghood http://hackage.haskell.org/package/GHood
best regards Miguel Vilaça
A 2010/03/23, às 05:31, Ronald Guida escreveu:
On Mon, Mar 22, 2010 at 7:02 PM, Dupont Corentin <corentin.dupont@gmail.com> wrote:
Hello, I’m relatively new to Haskell.
I’m wondering if it exist a tool to graphically represent Haskell code.
...
Let’s try to do it on a simple example, as an exercise:
f = Map (+1)
Your graphic for "f = map (+1)" seems much more complex than the corresponding code. I would agree with Ivan Miljenovic:
I'm of the opinion that unless you just use it on small snippets,
the generated images will be too large and unwieldy.
The first question I would ask is /why/ would you like to visualize some Haskell code? If you want to see the high-level structure of a complex program, try SourceGraph. (I have never used it though.)
On the other hand, if you are trying to visualize Haskell as part of your efforts to learn the language, then I believe it would be best to draw diagrams by hand, rather than relying on an automated tool. The kinds of things that you'll want to depict are probably going to vary considerably, depending on what you're trying to understand.
Consider a few different implementations of the "map" function:
-- version 1: recursion map1 :: (a -> b) -> [a] -> [b] map1 f [] = [] map1 f (x:xs) = (f x) : map1 f xs
-- version 2: fold map2 :: (a -> b) -> [a] -> [b] map2 f = foldr ((:) . f) []
-- version 3: continuation passing style map3 :: (a -> b) -> [a] -> [b] map3 f xs = map' (\x y -> f x : y) xs where map' k [] = [] map' k (y:ys) = k y (map' k ys)
-- version 4: list comprehension map4 :: (a -> b) -> [a] -> [b] map4 f xs = [f x | x <- xs]
-- version 5: list monad map5 :: (a -> b) -> [a] -> [b] map5 f xs = xs >>= (return . f)
These all do exactly the same thing, but each one uses different techniques. If I'm trying to learn (or teach) Haskell, I would probably need a slightly different visual "language" for each one in order to capture the most relevant concepts in a useful way. How would you visualize them?
@Mihai Maruseac: I think a visual debugger would be a wonderful idea. You may want to consider how a visual debugger would work with each of these versions of map.
:-) You might also consider several versions of factorial :-) http://www.willamette.edu/~fruehr/haskell/evolution.html<http://www.willamette.edu/%7Efruehr/haskell/evolution.html>
-- Ron _______________________________________________ Haskell-Cafe mailing list Haskell-Cafe@haskell.org http://www.haskell.org/mailman/listinfo/haskell-cafe
_______________________________________________ Haskell-Cafe mailing list Haskell-Cafe@haskell.org http://www.haskell.org/mailman/listinfo/haskell-cafe

Those are some very interesting visual languages, Miguel! I remember drawing some diagrams when I was teaching myself Haskell, but I never actually tried to create a formal visual language. Since my background is in hardware engineering, I would naturally gravitate toward schematic diagrams. I am also familiar with the graphical programming language of LabView. After reading Miguel's exposition, I thought about how I might draw a picture of map1. map1 :: (a -> b) -> [a] -> [b] map1 f [] = [] map1 f (x:xs) = (f x) : map1 f xs [image: map1.png] (Image created with Inkscape) Here is what I'm thinking: * Green boxes represent inputs and outputs. * Inputs are always on the left, outputs are always on the right. * Inputs appear in top-to-bottom order. * Data always flows left to right. * Arrows represent data flow. * A named white rectangle represents application of the named function. * A gray rectangle represents a function that arrives through data flow. * A filled-in arrowhead means the data "in" the arrow is to be "unpacked" and used as a function. * A named light-blue rectangle (such as on the left, with a colon in it) represents a pattern match operation. In thinking about this, I can sense that there are MANY issues with using a visual language to represent Haskell. Some issues I can think of: * How to represent pattern matching? * How to represent partial application? * How to represent data types or class constraints in the diagram? * How to represent a list comprehension or a do statement? (These might require special visual syntax) * Will the data flow always take the form of a directed acyclic graph, so that data never has to flow right-to-left? (Perhaps there's a way to "tie the knot" and get a cycle in the data flow graph.) * Whether to create special symbols for certain commonly used functions? (In digital circuit schematics, AND, OR, and NOT gates have special symbols, but most compound circuits are represented with labeled rectangles.) Also, if I want to automatically generate an image from a Haskell function, then my image generator needs to automatically place and route all those boxes. I'll have to give more thought to the other versions of map, and maybe make some more diagrams. -- Ron

On Mar 25, 2010, at 2:33 PM, Ronald Guida wrote: ... a version of map as text ... ... a diagram ... The thing that strikes me forcibly is that the diagram is much bigger than the text. Not only that, but if I am reading it correctly, the text has three lines, a type specification and two cases, and the diagram covers only one of the two cases. This isn't Ronald Guida's fault. In fact his is a very nice looking diagram, and I could figure it out without his explanation of the notation, *given* the textual version to start from. I've seen several visual programming tools, including e-Toys in Squeak, and they tend to be really cool ways to quickly build programs with trivial structures. (I did not say trivial programs: you can build useful programs that do highly non-trivial things, when the things that are primitives _for the notation_ are capable enough. Some data mining products have visual wire-up-these-tools-into-a-workflow, for example.)
On Wed, Mar 24, 2010 at 9:47 PM, Richard O'Keefe <ok@cs.otago.ac.nz> wrote:
On Mar 25, 2010, at 2:33 PM, Ronald Guida wrote: ... a version of map as text ... ... a diagram ...
The thing that strikes me forcibly is that the diagram is much bigger than the text. Not only that, but if I am reading it correctly, the text has three lines, a type specification and two cases, and the diagram covers only one of the two cases.
I agree, absolutely! One of the things I don't like about schematics (for digital circuits anyway) is the fact that a schematic is often bigger than the corresponding VHDL code, and VHDL is a *very* verbose hardware design language. On the other hand, sometimes one can visually "read" a schematic faster than reading the corresponding code. My preference is to describe digital circuits using hardware design language.
This isn't Ronald Guida's fault. In fact his is a very nice looking diagram, and I could figure it out without his explanation of the notation, *given* the textual version to start from.
I've seen several visual programming tools, including e-Toys in Squeak, and they tend to be really cool ways to quickly build programs with trivial structures.
(I did not say trivial programs: you can build useful programs that do highly non-trivial things, when the things that are primitives _for the notation_ are capable enough. Some data mining products have visual wire-up-these-tools-into-a-workflow, for example.)
I find it easier to "type" what I want to do, using a textual programming language, rather than having to "drag and drop" and then draw lots of wires. I feel the bigger (rhetorical) question is: At the level of code, what good are visual programming languages? (To clarify, I know that diagrams are indispensable for describing designs. The question pertains to actual source code.) -- Ron

On Wed, 2010-03-24 at 21:33 -0400, Ronald Guida wrote:
Those are some very interesting visual languages, Miguel!
I remember drawing some diagrams when I was teaching myself Haskell, but I never actually tried to create a formal visual language. Since my background is in hardware engineering, I would naturally gravitate toward schematic diagrams. I am also familiar with the graphical programming language of LabView.
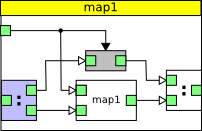
After reading Miguel's exposition, I thought about how I might draw a picture of map1.
map1 :: (a -> b) -> [a] -> [b] map1 f [] = [] map1 f (x:xs) = (f x) : map1 f xs
map1.png (Image created with Inkscape)
Here is what I'm thinking: * Green boxes represent inputs and outputs. * Inputs are always on the left, outputs are always on the right. * Inputs appear in top-to-bottom order. * Data always flows left to right. * Arrows represent data flow. * A named white rectangle represents application of the named function. * A gray rectangle represents a function that arrives through data flow. * A filled-in arrowhead means the data "in" the arrow is to be "unpacked" and used as a function. * A named light-blue rectangle (such as on the left, with a colon in it) represents a pattern match operation.
In thinking about this, I can sense that there are MANY issues with using a visual language to represent Haskell. Some issues I can think of: * How to represent pattern matching? * How to represent partial application? * How to represent data types or class constraints in the diagram? * How to represent a list comprehension or a do statement? (These might require special visual syntax) * Will the data flow always take the form of a directed acyclic graph, so that data never has to flow right-to-left? (Perhaps there's a way to "tie the knot" and get a cycle in the data flow graph.)
myfix f = let x = f x in x f -------\ | v /->X-X--+--------> | | \---<---/ Unless we rewrite it into: myfix' f = f (myfix' f) f ----+-------------------\ | | | v \->X myfix' X----->X-X---->
* Whether to create special symbols for certain commonly used functions? (In digital circuit schematics, AND, OR, and NOT gates have special symbols, but most compound circuits are represented with labeled rectangles.)
Also, if I want to automatically generate an image from a Haskell function, then my image generator needs to automatically place and route all those boxes.
I'll have to give more thought to the other versions of map, and maybe make some more diagrams.
-- Ron
Regards

Hmm, I may take hints from this conversation to improve the debugger. My program will draw only the diagrams needed for debugging, it is not about the programmer needing to draw boxes and wires but about him understanding his own code :) On Thu, Mar 25, 2010 at 4:37 AM, Maciej Piechotka <uzytkownik2@gmail.com> wrote:
On Wed, 2010-03-24 at 21:33 -0400, Ronald Guida wrote:
Those are some very interesting visual languages, Miguel!
I remember drawing some diagrams when I was teaching myself Haskell, but I never actually tried to create a formal visual language. Since my background is in hardware engineering, I would naturally gravitate toward schematic diagrams. I am also familiar with the graphical programming language of LabView.
After reading Miguel's exposition, I thought about how I might draw a picture of map1.
map1 :: (a -> b) -> [a] -> [b] map1 f [] = [] map1 f (x:xs) = (f x) : map1 f xs
map1.png (Image created with Inkscape)
Here is what I'm thinking: * Green boxes represent inputs and outputs. * Inputs are always on the left, outputs are always on the right. * Inputs appear in top-to-bottom order. * Data always flows left to right. * Arrows represent data flow. * A named white rectangle represents application of the named function. * A gray rectangle represents a function that arrives through data flow. * A filled-in arrowhead means the data "in" the arrow is to be "unpacked" and used as a function. * A named light-blue rectangle (such as on the left, with a colon in it) represents a pattern match operation.
In thinking about this, I can sense that there are MANY issues with using a visual language to represent Haskell. Some issues I can think of: * How to represent pattern matching? * How to represent partial application? * How to represent data types or class constraints in the diagram? * How to represent a list comprehension or a do statement? (These might require special visual syntax) * Will the data flow always take the form of a directed acyclic graph, so that data never has to flow right-to-left? (Perhaps there's a way to "tie the knot" and get a cycle in the data flow graph.)
myfix f = let x = f x in x
f -------\ | v /->X-X--+--------> | | \---<---/
Unless we rewrite it into:
myfix' f = f (myfix' f)
f ----+-------------------\ | | | v \->X myfix' X----->X-X---->
* Whether to create special symbols for certain commonly used functions? (In digital circuit schematics, AND, OR, and NOT gates have special symbols, but most compound circuits are represented with labeled rectangles.)
Also, if I want to automatically generate an image from a Haskell function, then my image generator needs to automatically place and route all those boxes.
I'll have to give more thought to the other versions of map, and maybe make some more diagrams.
-- Ron
Regards
_______________________________________________ Haskell-Cafe mailing list Haskell-Cafe@haskell.org http://www.haskell.org/mailman/listinfo/haskell-cafe
Hi, For Reekie's Visual Haskell, see http://ptolemy.eecs.berkeley.edu/~johnr/papers/visual.html Also take a look on the CAL language (http://openquark.org/Open_Quark/Welcome.html "Welcome to the (...) Open Quark Framework for Java, and the lazy functional language CAL." AFAIK, the CAL language is Haskell alike and have a nice editor!! Some papers that might be of interest: VEX: W. Citrin, R. Hall, and B. Zorn. Programming with visual ex- pressions. In VL ’95: Proceedings of the 11th International IEEE Symposium on Visual Languages, page 294, Washington, DC, USA, 1995. IEEE Computer Society. Pivotal Keith Hanna. Interactive Visual Functional Programming. In S Peyton Jones, editor, Proc. Intnl Conf. on Functional Programming, pages 100–112. ACM, October 2002. Visual Haskell Hideki John Reekie. Realtime Signal Processing – Dataflow, Visual, and Functional Programming. PhD thesis, University of Technology at Sydney, 1995. VPF Joel Kelso. A Visual Programming Environment for Functional Languages. PhD thesis, Murdoch University, 2002. Visual Lambda Laurent Dami and Didier Vallet. Higher-order functional composition in visual form. Technical report, University of Geneva, 1996. best regards Miguel Vilaça A 2010/03/24, às 23:30, Dupont Corentin escreveu:
Hello, Very interresting. Visual Haskell seems to be very close to the thing i imagined. Mihai what do you think? Unfortunatly i cannot find it on the web! There is something for MS Visual Studio but i don't think this is the same...
Corentin
On Thu, Mar 25, 2010 at 12:07 AM, Miguel Vilaca <jmvilaca@di.uminho.pt> wrote: Hi all,
Concerning INblobs, it's again online; a fire damaged the cable that links the university to the world!! I don't update the tool for a long time... but I'll take a look on that.
Concerning visual functional programming, see this small chapter of my thesis about some of the existing languages.
There are more subtleties on the visual side than those expected!!
If you also consider debugging tools, take a look on Ghood http://hackage.haskell.org/package/GHood
best regards Miguel Vilaça
A 2010/03/23, às 05:31, Ronald Guida escreveu:
On Mon, Mar 22, 2010 at 7:02 PM, Dupont Corentin <corentin.dupont@gmail.com> wrote:
Hello, I’m relatively new to Haskell. I’m wondering if it exist a tool to graphically represent Haskell code. ... Let’s try to do it on a simple example, as an exercise: f = Map (+1)
Your graphic for "f = map (+1)" seems much more complex than the corresponding code. I would agree with Ivan Miljenovic:
I'm of the opinion that unless you just use it on small snippets, the generated images will be too large and unwieldy.
The first question I would ask is /why/ would you like to visualize some Haskell code? If you want to see the high-level structure of a complex program, try SourceGraph. (I have never used it though.)
On the other hand, if you are trying to visualize Haskell as part of your efforts to learn the language, then I believe it would be best to draw diagrams by hand, rather than relying on an automated tool. The kinds of things that you'll want to depict are probably going to vary considerably, depending on what you're trying to understand.
Consider a few different implementations of the "map" function:
-- version 1: recursion map1 :: (a -> b) -> [a] -> [b] map1 f [] = [] map1 f (x:xs) = (f x) : map1 f xs
-- version 2: fold map2 :: (a -> b) -> [a] -> [b] map2 f = foldr ((:) . f) []
-- version 3: continuation passing style map3 :: (a -> b) -> [a] -> [b] map3 f xs = map' (\x y -> f x : y) xs where map' k [] = [] map' k (y:ys) = k y (map' k ys)
-- version 4: list comprehension map4 :: (a -> b) -> [a] -> [b] map4 f xs = [f x | x <- xs]
-- version 5: list monad map5 :: (a -> b) -> [a] -> [b] map5 f xs = xs >>= (return . f)
These all do exactly the same thing, but each one uses different techniques. If I'm trying to learn (or teach) Haskell, I would probably need a slightly different visual "language" for each one in order to capture the most relevant concepts in a useful way. How would you visualize them?
@Mihai Maruseac: I think a visual debugger would be a wonderful idea. You may want to consider how a visual debugger would work with each of these versions of map.
:-) You might also consider several versions of factorial :-) http://www.willamette.edu/~fruehr/haskell/evolution.html
-- Ron _______________________________________________ Haskell-Cafe mailing list Haskell-Cafe@haskell.org http://www.haskell.org/mailman/listinfo/haskell-cafe
_______________________________________________ Haskell-Cafe mailing list Haskell-Cafe@haskell.org http://www.haskell.org/mailman/listinfo/haskell-cafe
participants (6)
-
 Dupont Corentin
 -
 Maciej Piechotka
 -
 Miguel Vilaca
 -
 Mihai Maruseac
 -
 Richard O'Keefe
 -
 Ronald Guida