Space Leak with semi-implicit parallelization and the nasty Garbage collector

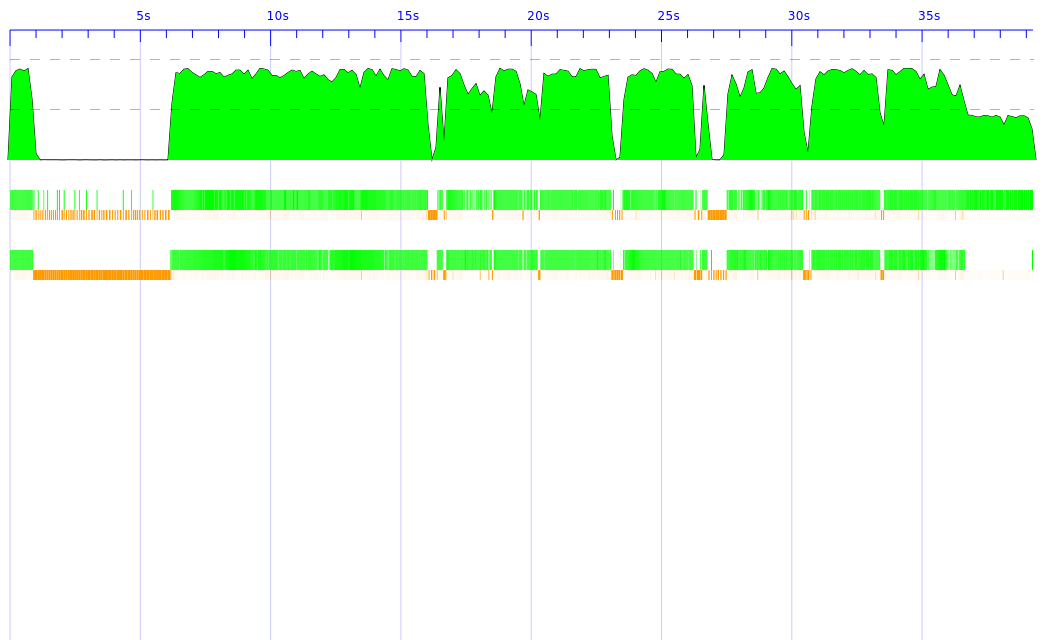
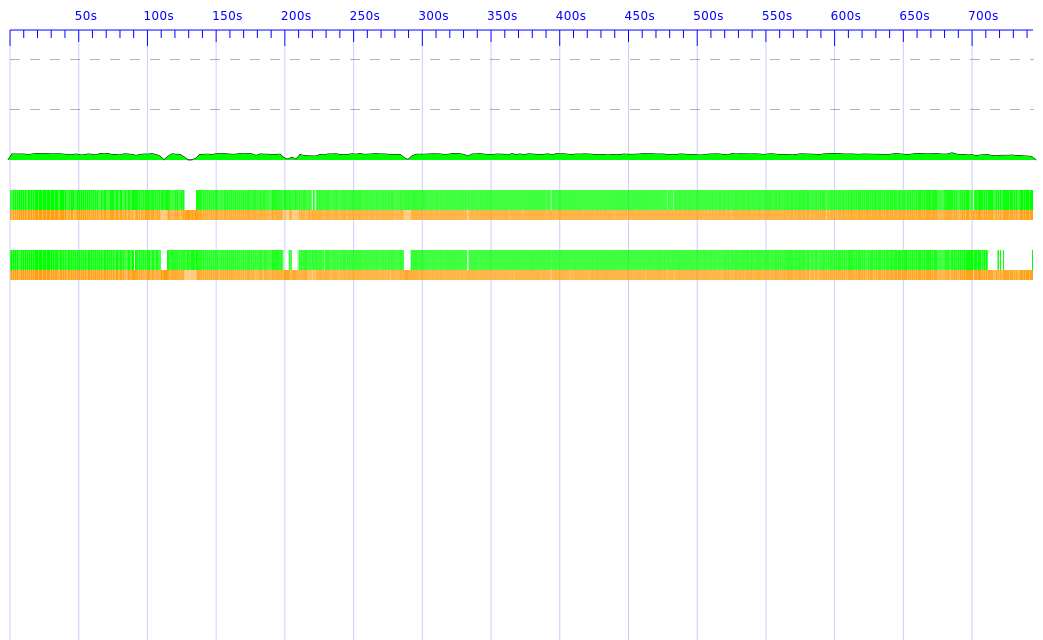
Hello haskell-cafe (and merry christmas!), I have a strange problem with the garbage collector / memory which I'm unable to find a solution for. I think the source of my problems has to do with lazy evaluation, but currently I'm unable to find it. Using the attached program and threadscope I see that the GC is using a lot of time and the program comes (more or less) to a halt (see exa-1.png). When I increase the heap the program takes much longer and the GC is running more or less all the time (see exa-2.png). Some more detailled information: * I can see the described behaviour under both GHC 10.4 and GHC 12.1 * Linux kernel 2.6.31-16 on a dualcore * Program compiled with ghc --make -O2 -threaded -eventlog Example.hs -o exa * Started with exa +RTS -ls and one of { -N, -N1, -N2 } Any help (pointing into the right direction, mention possibly helpful blog articles or paper, constructive critic in general) is appreciated! Best wishes, Michael PS: 1. I hope the graphs are good enough to see the problem 2. Is it a known bug that threadscope eats 100%+ CPU when I just view an eventlog? ------------------------------------------------------------------------------- -- -- Minimal test example for problems with garbage collection (both under -- GHC6.10.4 and GHC6.12.1). We calculate Pi to an arbitrary length (here -- 50.000 + n) for n times using Machin's formula[1]. -- -- [1] http://en.literateprograms.org/Pi_with_Machin's_formula_(Haskell) ------------------------------------------------------------------------------- module Main where import Control.Parallel import Control.Parallel.Strategies main = do -- 20 tasks, length 50000 + [1..20] let values = implicit (initTasks 20 50000) -- Dirty trick to force evaluation: mapM_ (print . (`mod` 10)) values ------------------------------------------------------------------------------- -- Using semi-implicit parallelization here. implicit :: [PiTask] -> [Integer] implicit tasks = parMap rdeepseq (\(PiTask k) -> calcPiPure k) tasks ------------------------------------------------------------------------------- -- Definition of a task to calculate \pi to an arbitrary length and its -- implementation. data PiTask = PiTask Integer instance Show PiTask where show (PiTask i) = "PiTask <" ++ show i ++ ">" -- Returns @number@ tasks of length @len@ up to @len+number@. We add one for -- each successive task to prevent additional compiler or runtime optimizations -- through referential transparency. In dimensions of 10^5 this should not make a -- measureable difference. initTasks :: Int -> Int -> [PiTask] initTasks number len = let len' = toEnum len num' = toEnum number in map PiTask [len'..len'+num'] -- Not used here calcPi :: Integer -> IO () calcPi digits = calcPiPure digits `pseq` return () calcPiPure :: Integer -> Integer calcPiPure digits = pi' `div` (10 ^ (10 :: Integer)) where unity = 10 ^ (toInteger digits + 10) pi' = 4 * (4 * arccot 5 unity - arccot 239 unity :: Integer) arccot :: Integral t => t -> t -> t arccot x unity = arccot' x unity 0 start 1 1 where start = unity `div` x arccot' x' u sm xpower n sign | xpower `div` n == 0 = sm | otherwise = arccot' x' u (sm + sign*term) (xpower `div` (x'*x')) (n+2) (-sign) where term = xpower `div` n

Am Donnerstag 24 Dezember 2009 02:14:51 schrieb Michael Lesniak:
Hello haskell-cafe (and merry christmas!),
I have a strange problem with the garbage collector / memory which I'm unable to find a solution for. I think the source of my problems has to do with lazy evaluation, but currently I'm unable to find it.
Using the attached program and threadscope I see that the GC is using a lot of time and the program comes (more or less) to a halt (see exa-1.png). When I increase the heap the program takes much longer and the GC is running more or less all the time (see exa-2.png).
Some more detailled information:
* I can see the described behaviour under both GHC 10.4 and GHC 12.1 * Linux kernel 2.6.31-16 on a dualcore * Program compiled with ghc --make -O2 -threaded -eventlog Example.hs -o exa * Started with exa +RTS -ls and one of { -N, -N1, -N2 }
Any help (pointing into the right direction, mention possibly helpful blog articles or paper, constructive critic in general) is appreciated!
I can't reproduce that (ghc-6.12.1, Linux linux-mkk1 2.6.27.39-0.2-pae #1 SMP 2009-11-23 12:57:38 +0100 i686 i686 i386 GNU/Linux, dual core): $ time ./exa +RTS -ls -N2 -sstderr ./exa +RTS -ls -N2 -sstderr 1 3 0 0 9 3 6 9 1 8 8 9 2 5 5 8 6 5 7 8 4 72,499,126,908 bytes allocated in the heap 45,280,708 bytes copied during GC 177,504 bytes maximum residency (10 sample(s)) 183,844 bytes maximum slop 4 MB total memory in use (1 MB lost due to fragmentation) Generation 0: 131527 collections, 131526 parallel, 7.18s, 3.88s elapsed Generation 1: 10 collections, 10 parallel, 0.00s, 0.00s elapsed Parallel GC work balance: 1.16 (10931266 / 9433437, ideal 2) MUT time (elapsed) GC time (elapsed) Task 0 (worker) : 115.10s (126.56s) 3.34s ( 1.84s) Task 1 (worker) : 124.21s (126.56s) 3.84s ( 2.04s) Task 2 (worker) : 0.09s (126.56s) 0.00s ( 0.00s) Task 3 (worker) : 0.00s (126.56s) 0.00s ( 0.00s) SPARKS: 21 (21 converted, 0 pruned) INIT time 0.00s ( 0.13s elapsed) MUT time 238.05s (126.56s elapsed) GC time 7.19s ( 3.88s elapsed) EXIT time 0.00s ( 0.00s elapsed) Total time 244.46s (130.57s elapsed) %GC time 2.9% (3.0% elapsed) Alloc rate 305,559,453 bytes per MUT second Productivity 97.1% of total user, 181.7% of total elapsed gc_alloc_block_sync: 151252 whitehole_spin: 0 gen[0].steps[0].sync_large_objects: 75620 gen[0].steps[1].sync_large_objects: 9662 gen[1].steps[0].sync_large_objects: 0 244.45user 2.06system 2:10.58elapsed 188%CPU (0avgtext+0avgdata 0maxresident)k 0inputs+35736outputs (0major+2426minor)pagefaults 0swaps Garbage collection isn't even visible in the threadscope profile. With -N1: 71,999,280,108 bytes allocated in the heap 20,729,380 bytes copied during GC 92,492 bytes maximum residency (2 sample(s)) 190,872 bytes maximum slop 3 MB total memory in use (0 MB lost due to fragmentation) Generation 0: 130901 collections, 0 parallel, 2.64s, 2.68s elapsed Generation 1: 2 collections, 0 parallel, 0.00s, 0.00s elapsed Parallel GC work balance: nan (0 / 0, ideal 1) MUT time (elapsed) GC time (elapsed) Task 0 (worker) : 184.86s (206.14s) 2.38s ( 2.40s) Task 1 (worker) : 0.00s (216.71s) 0.00s ( 0.00s) Task 2 (worker) : 20.90s (216.71s) 0.26s ( 0.28s) SPARKS: 21 (19 converted, 2 pruned) INIT time 0.00s ( 0.05s elapsed) MUT time 215.33s (216.71s elapsed) GC time 2.64s ( 2.68s elapsed) EXIT time 0.00s ( 0.00s elapsed) Total time 217.96s (219.44s elapsed) %GC time 1.2% (1.2% elapsed) Alloc rate 334,374,215 bytes per MUT second Productivity 98.8% of total user, 98.1% of total elapsed gc_alloc_block_sync: 0 whitehole_spin: 0 gen[0].steps[0].sync_large_objects: 0 gen[0].steps[1].sync_large_objects: 0 gen[1].steps[0].sync_large_objects: 0 217.96user 0.88system 3:39.52elapsed 99%CPU (0avgtext+0avgdata 0maxresident)k 1576inputs+19552outputs (5major+1686minor)pagefaults 0swaps
Best wishes, Michael
Hello Daniel, thanks for your fast response. That's strange: On your system "total time elapsed" according to GHC is ~190%, on mine (reproducible!) ~140% (see below). I once had a problem with a particular linux kernel[1], unfortunately I currently (over the holidays) have no other computers available. Does anyone also have an up-to-date ubuntu karmic 9.10 with my kernel version to confirm or refute the problem's dependency on the linux kernel? A bit irritated, but still in an Haskelllish christmas mood, Michael [1] http://www.mail-archive.com/haskell-cafe@haskell.org/msg67148.html
time exa +RTS -N2 -ls -sstderr exa +RTS -N2 -ls -sstderr 1 3 0 0 9 3 6 9 1 8 8 9 2 5 5 8 6 5 7 8 4 72,748,227,888 bytes allocated in the heap 65,331,056 bytes copied during GC 183,032 bytes maximum residency (22 sample(s)) 209,352 bytes maximum slop 4 MB total memory in use (1 MB lost due to fragmentation)
Generation 0: 131339 collections, 131338 parallel, 7.29s, 6.25s elapsed
Generation 1: 22 collections, 22 parallel, 0.03s, 0.03s elapsed
Parallel GC work balance: 1.10 (7778368 / 7059369, ideal 2)
MUT time (elapsed) GC time (elapsed)
Task 0 (worker) : 66.38s ( 36.22s) 1.75s ( 1.37s)
Task 1 (worker) : 66.40s ( 36.25s) 0.00s ( 0.00s)
Task 2 (worker) : 68.13s ( 36.25s) 0.00s ( 0.00s)
Task 3 (worker) : 62.56s ( 36.25s) 5.57s ( 4.91s)
SPARKS: 21 (21 converted, 0 pruned)
INIT time 0.00s ( 0.01s elapsed)
MUT time 60.81s ( 36.25s elapsed)
GC time 7.32s ( 6.28s elapsed)
EXIT time 0.00s ( 0.00s elapsed)
Total time 66.40s ( 42.54s elapsed)
%GC time 11.0% (14.8% elapsed)
Alloc rate 1,231,351,182 bytes per MUT second
Productivity 89.0% of total user, 138.9% of total elapsed
gc_alloc_block_sync: 61137
whitehole_spin: 0
gen[0].steps[0].sync_large_objects: 17681
gen[0].steps[1].sync_large_objects: 20647
gen[1].steps[0].sync_large_objects: 0
real 0m42.626s
user 1m6.400s
sys 0m0.510s
2009/12/24 Daniel Fischer
Am Donnerstag 24 Dezember 2009 02:14:51 schrieb Michael Lesniak:
Hello haskell-cafe (and merry christmas!),
I have a strange problem with the garbage collector / memory which I'm
unable to find a solution for. I think the source of my problems has to do
with lazy evaluation, but currently I'm unable to find it.
Using the attached program and threadscope I see that the GC is using a lot
of time and the program comes (more or less) to a halt (see exa-1.png).
When I increase the heap the program takes much longer and the GC is
running more or less all the time (see exa-2.png).
Some more detailled information:
* I can see the described behaviour under both GHC 10.4 and GHC 12.1
* Linux kernel 2.6.31-16 on a dualcore
* Program compiled with ghc --make -O2 -threaded -eventlog Example.hs -o
exa * Started with exa +RTS -ls and one of { -N, -N1, -N2 }
Any help (pointing into the right direction, mention possibly helpful
blog articles
or paper, constructive critic in general) is appreciated!
I can't reproduce that (ghc-6.12.1, Linux linux-mkk1 2.6.27.39-0.2-pae #1 SMP 2009-11-23 12:57:38 +0100 i686 i686 i386 GNU/Linux, dual core):
$ time ./exa +RTS -ls -N2 -sstderr
./exa +RTS -ls -N2 -sstderr
1
3
0
0
9
3
6
9
1
8
8
9
2
5
5
8
6
5
7
8
4
72,499,126,908 bytes allocated in the heap
45,280,708 bytes copied during GC
177,504 bytes maximum residency (10 sample(s))
183,844 bytes maximum slop
4 MB total memory in use (1 MB lost due to fragmentation)
Generation 0: 131527 collections, 131526 parallel, 7.18s, 3.88s elapsed
Generation 1: 10 collections, 10 parallel, 0.00s, 0.00s elapsed
Parallel GC work balance: 1.16 (10931266 / 9433437, ideal 2)
MUT time (elapsed) GC time (elapsed)
Task 0 (worker) : 115.10s (126.56s) 3.34s ( 1.84s)
Task 1 (worker) : 124.21s (126.56s) 3.84s ( 2.04s)
Task 2 (worker) : 0.09s (126.56s) 0.00s ( 0.00s)
Task 3 (worker) : 0.00s (126.56s) 0.00s ( 0.00s)
SPARKS: 21 (21 converted, 0 pruned)
INIT time 0.00s ( 0.13s elapsed)
MUT time 238.05s (126.56s elapsed)
GC time 7.19s ( 3.88s elapsed)
EXIT time 0.00s ( 0.00s elapsed)
Total time 244.46s (130.57s elapsed)
%GC time 2.9% (3.0% elapsed)
Alloc rate 305,559,453 bytes per MUT second
Productivity 97.1% of total user, 181.7% of total elapsed
gc_alloc_block_sync: 151252
whitehole_spin: 0
gen[0].steps[0].sync_large_objects: 75620
gen[0].steps[1].sync_large_objects: 9662
gen[1].steps[0].sync_large_objects: 0
244.45user 2.06system 2:10.58elapsed 188%CPU (0avgtext+0avgdata 0maxresident)k
0inputs+35736outputs (0major+2426minor)pagefaults 0swaps
Garbage collection isn't even visible in the threadscope profile.
With -N1:
71,999,280,108 bytes allocated in the heap
20,729,380 bytes copied during GC
92,492 bytes maximum residency (2 sample(s))
190,872 bytes maximum slop
3 MB total memory in use (0 MB lost due to fragmentation)
Generation 0: 130901 collections, 0 parallel, 2.64s, 2.68s elapsed
Generation 1: 2 collections, 0 parallel, 0.00s, 0.00s elapsed
Parallel GC work balance: nan (0 / 0, ideal 1)
MUT time (elapsed) GC time (elapsed)
Task 0 (worker) : 184.86s (206.14s) 2.38s ( 2.40s)
Task 1 (worker) : 0.00s (216.71s) 0.00s ( 0.00s)
Task 2 (worker) : 20.90s (216.71s) 0.26s ( 0.28s)
SPARKS: 21 (19 converted, 2 pruned)
INIT time 0.00s ( 0.05s elapsed)
MUT time 215.33s (216.71s elapsed)
GC time 2.64s ( 2.68s elapsed)
EXIT time 0.00s ( 0.00s elapsed)
Total time 217.96s (219.44s elapsed)
%GC time 1.2% (1.2% elapsed)
Alloc rate 334,374,215 bytes per MUT second
Productivity 98.8% of total user, 98.1% of total elapsed
gc_alloc_block_sync: 0
whitehole_spin: 0
gen[0].steps[0].sync_large_objects: 0
gen[0].steps[1].sync_large_objects: 0
gen[1].steps[0].sync_large_objects: 0
217.96user 0.88system 3:39.52elapsed 99%CPU (0avgtext+0avgdata 0maxresident)k
1576inputs+19552outputs (5major+1686minor)pagefaults 0swaps
Best wishes,
Michael
-- Dipl.-Inf. Michael C. Lesniak University of Kassel Programming Languages / Methodologies Research Group Department of Computer Science and Electrical Engineering Wilhelmshöher Allee 73 34121 Kassel Phone: +49-(0)561-804-6269
participants (2)
-
 Daniel Fischer
 -
 Michael Lesniak