[Haskell-Cafe] Different memory profile in cabal project.

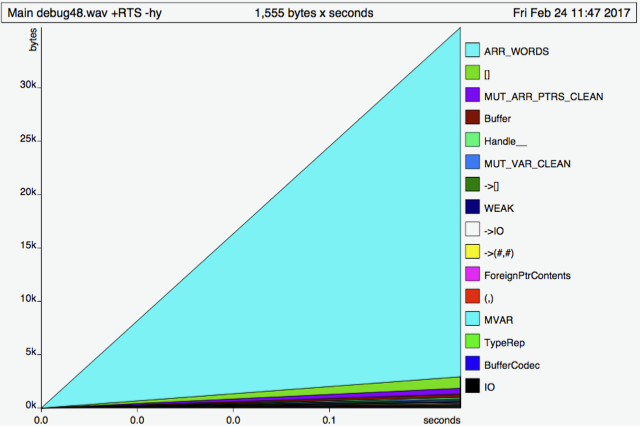
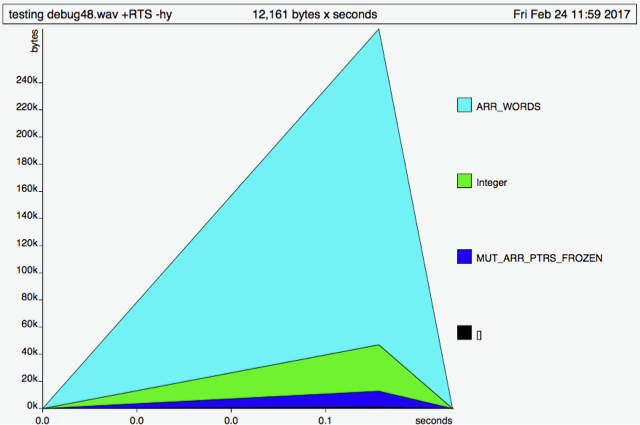
I have a (dummy) program that reads the contents of a file into a ByteString and then converts the ByteString to a Vector of Floats. To test the laziness of this program, I’ve taken a slice of the the Vector and printed it to the standard output. The program looks like this: import qualified Data.Vector.Unboxed as V import qualified Data.ByteString as BS import Data.Word import System.Environment import GHC.Int main = do [file] <- getArgs samples <- getSamplesFromFile file let slice = V.slice 0 50000 samples print slice getSamplesFromFile = fmap toVector . BS.readFile toVector :: BS.ByteString -> V.Vector Float toVector bs = vgenerate (fromIntegral (BS.length bs `div` 3)) $ \i -> myToFloat [BS.index bs (3*i), BS.index bs (3*i+1), BS.index bs (3*i+2)] where myToFloat :: [Word8] -> Float myToFloat = sum . map fromIntegral vgenerate n f = V.generate n (f . fromIntegral) So I compile this program and generate a memory profile via: ghc Main.hs -O2 -rtsopts -prof ./Main debug48.wav +RTS -hy hp2ps -e8in -c Main.hp ps2pdf Main.ps The file debug48.wav is a 12.9MB file. This is the result: If I now create a cabal project and add the exact same program as the main file by: mkdir testing cd testing cabal init add the program’s code to src/Main.hs add bytestring and vector to the build dependencies (in testing.cabal) add -O2 -rtsopts -prof to the ghc-options (in testing.cabal) cabal install testing debug48.wav +RTS -hy hp2ps -e8in -c testing.hp ps2pdf testing.ps This is the result: How can there be such a big difference in memory usage, just by the code being part of a cabal project?
participants (1)
-
 Thomas Vanhelden